You are leaving iBoneAcademy.com
You are about to leave the iBoneAcademy.com website and enter a website operated by a third party. Amgen is not responsible for and does not control the content contained on this third-party website.
You are about to leave the iBoneAcademy.com website and enter a website operated by a third party. Amgen is not responsible for and does not control the content contained on this third-party website.
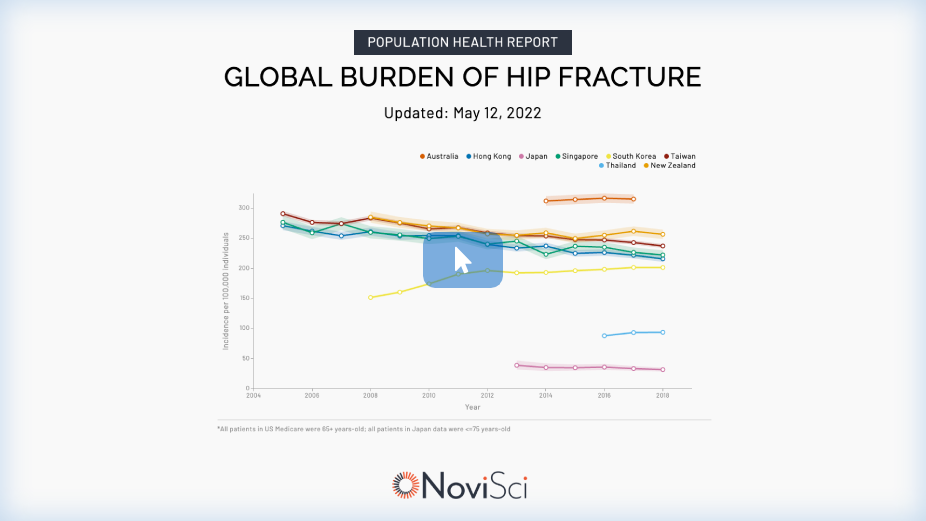
Hip fractures are a major public health concern, leading to several complications in patients.1 Use this interactive tool to visualize the incidence, pharmacological treatment rates, and projections of hip fracture worldwide.
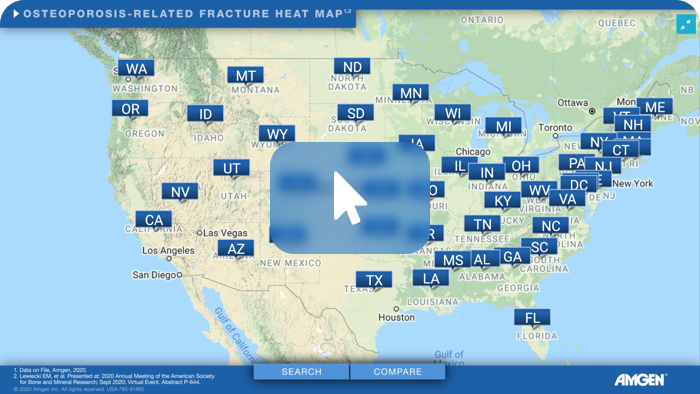
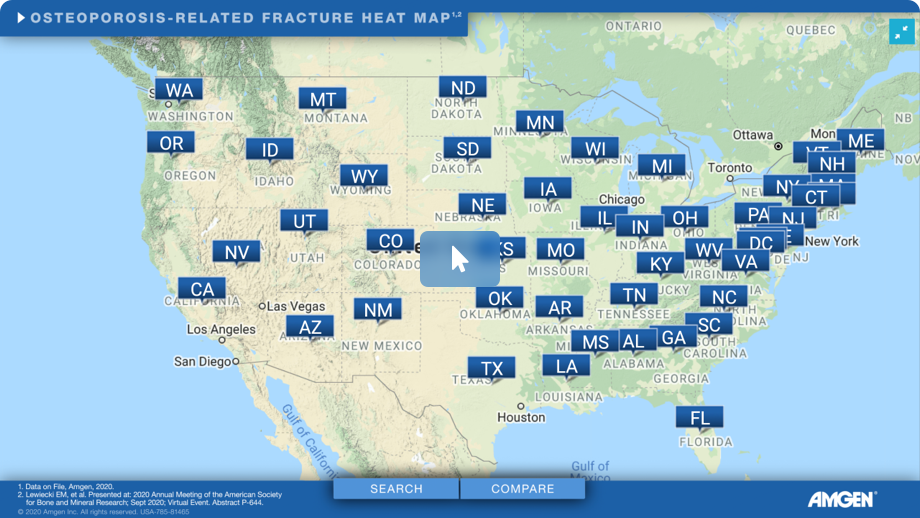
This interactive heat map shows the distribution in the US of fragility fractures in postmenopausal women aged ≥ 66 at a state, county, or ZIP code level.* The tool also reports the distribution of patients who received a clinical diagnosis of osteoporosis, the distribution of patients who received osteoporosis treatment, and the occurrence of subsequent osteoporosis-related fractures.
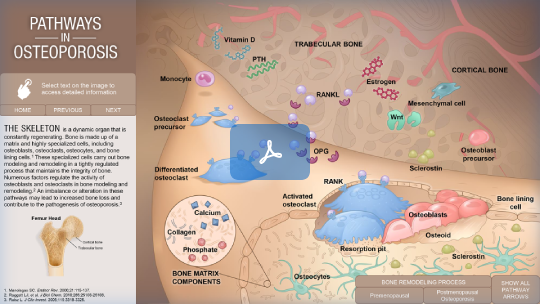

Use our interactive tool to explore osteoporosis from the inside out and access in-depth information about the disease pathways.
Women are more likely to have osteoporosis-related fractures† than to be diagnosed with breast cancer.2,‡ Understand which of your patients could be at risk and how a diagnosis could impact their daily life.
*Retrospective analysis of 100% Fee-for-Service Medicare beneficiaries' data. †2006 new cases, women all ages. ‡2005 annual incident all ages.
1. Camacho PM, et al. Endocr Pract. 2020;26(suppl 1):1-46. 2. Watts N, et al. Endocr Pract. 2010;16(suppl 3):1-37.
These materials are provided for educational and non-commercial purposes only. All materials provided herein are licensed for use only under the Creative Common Attribution-Non-Commercial-No Derivatives 4.0 International Public License linked here.